Quantitative PCR (qPCR) or real-time PCR (RT-PCR) detects and quantifies nucleic acid on a real-time basis. qPCR is rapid and sensitive, so it is ideal for applications in gene expression analysis, pathogen and microbe detection, and clinical diagnostics. In this blog we give a short introduction to qPCR, the methodology and the most common applications. We also discuss the equipment needed and present some useful reagents that will help you set up and optimize qPCR workflows.
The principle of qPCR
Unlike end-point PCR, which detects the maximum number of copies of the DNA or RNA target produced at the end of a fixed number of PCR cycles, qPCR continuously monitors the PCR reaction and records the number of amplicons created. This is done by adding a fluorescent label, which permits quantitation of amplicons by measuring the fluorescence produced after each amplification cycle.
Broadly speaking, qPCR assays fall into two categories: dye-based and probe-based. Dye-based assays use a DNA binding dye, such as FastGene IC Green or SYBR Green to monitor the general amplification of DNA in the qPCR reaction. Probe-based assays use short, dye-labeled oligonucleotides (so-called probes) to specifically detect the amplification of target sequences in the qPCR reaction.
Whereas dye-based assays are cheaper to use, probe-based assays are more specific and generate less background.
Instrumentation
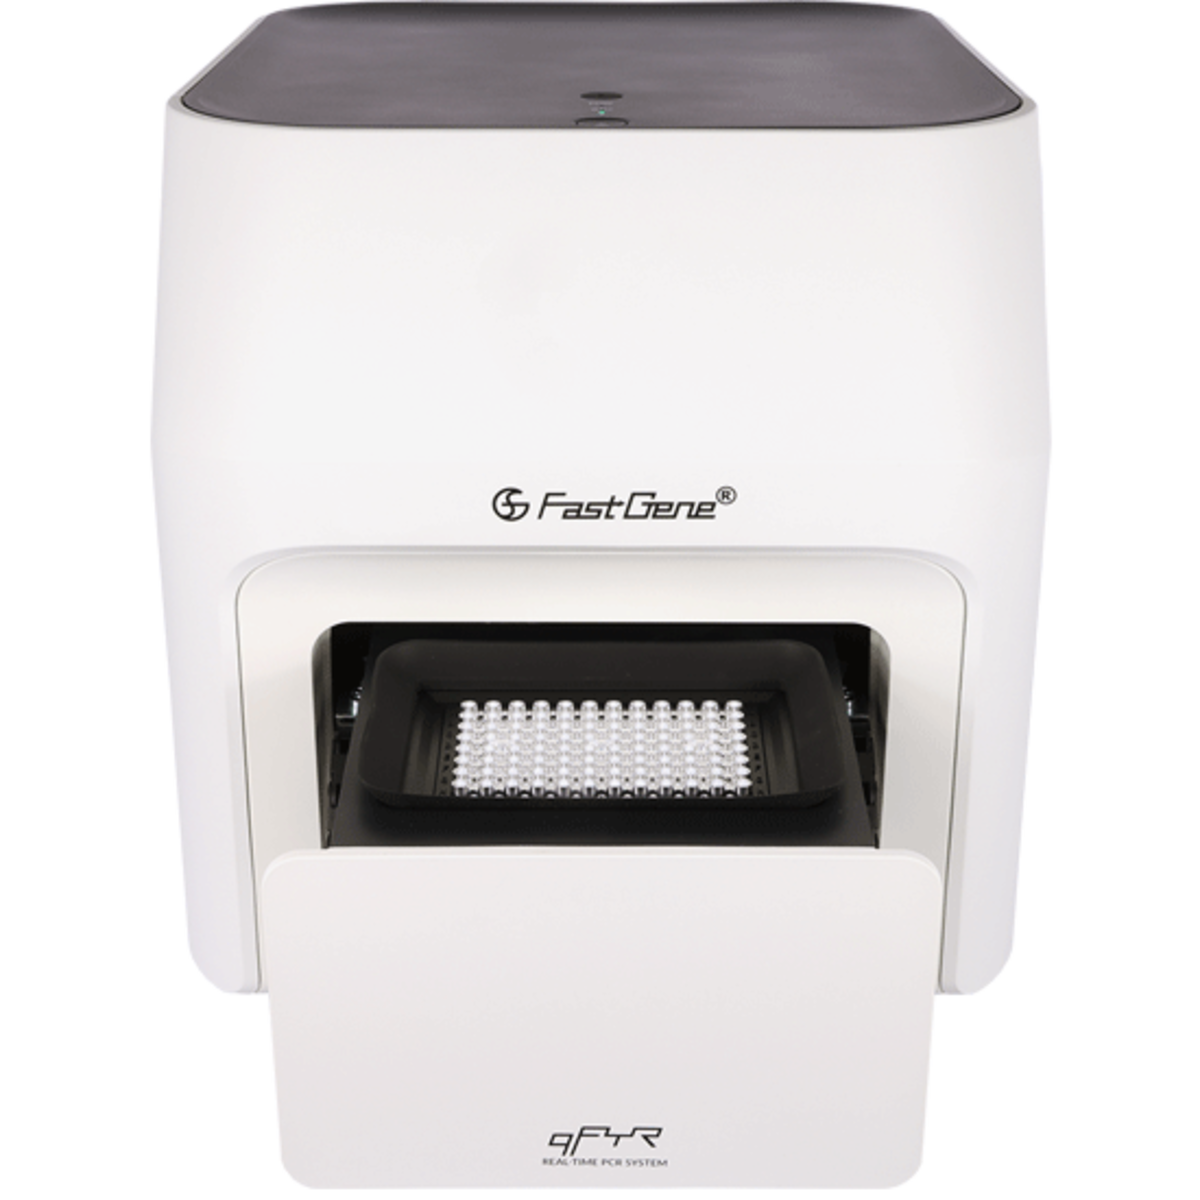
A specific qPCR instrument is needed to measure fluorescence in a qPCR reaction and a wide variety of instrument models from various manufacturers exist. All qPCR instruments contain three main components: a thermal cycling block, a light source, and a detector. Excitation and emission wavelengths of the instrument filters must be compatible with the fluorescent dyes used in the qPCR assay. An example of a high-end qPCR instrument is the FastGene qFYR Real-Time PCR System from Nippon Genetics. It has very fast cycling speeds, four channels for multiplex qPCR and the analysis software is included, making data analysis and interpretation straightforward.
Analyzing and understanding data from qPCR runs
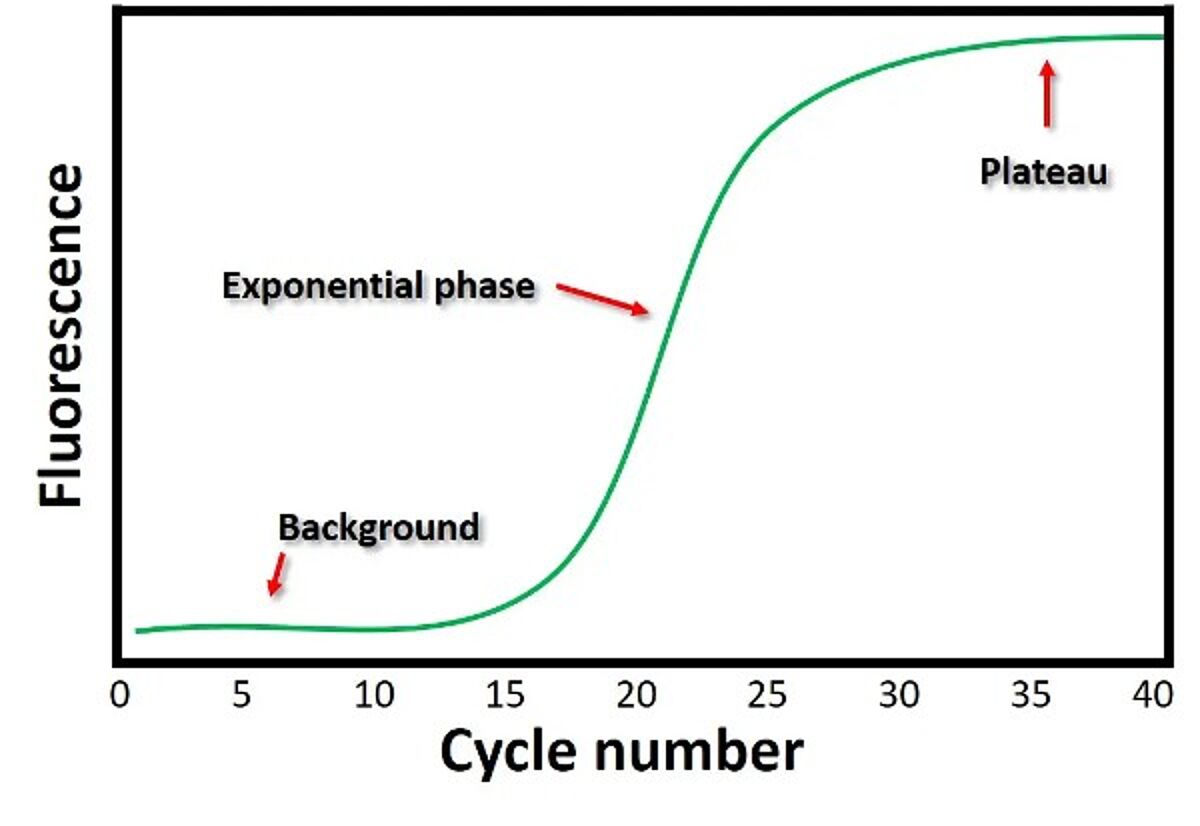
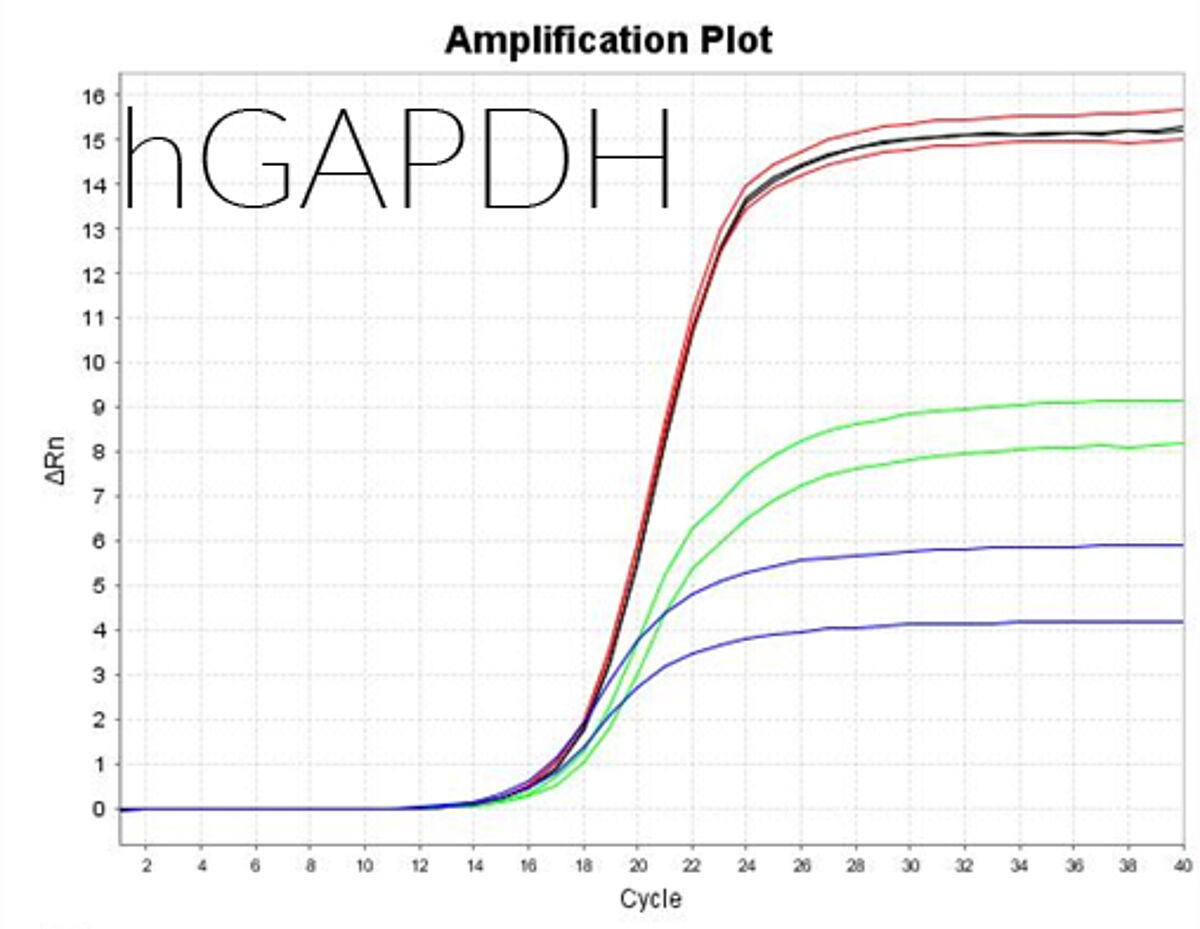
The data generated by the instrument is plotted in an amplification plot — fluorescence on the y-axis and cycle number on the x-axis. There are two main phases in an amplification plot: exponential and plateau. The exponential phase achieves the highest precision, as the amplicon concentration approximately doubles in each cycle. The threshold value or Quantification Cycle (Cq) is taken manually or automatically using qPCR software at the beginning of the exponential phase when the fluorescence emission is significantly higher than the background reading. Samples with higher concentrations are detected earlier (have lower Cq values). Comparing Cq values is an example of relative quantification. Absolute quantification is possible with qPCR by using reference standards to generate a standard curve. The concentration of unknown samples can be determined from the plot of Cq values against the quantity of each standard. PCR efficiency and reproducibility can be determined from the standard curves.
Additional information
Dye-based qPCR approaches
Double-stranded DNA (dsDNA) dyes, such as FastGene IC Green or SYBR®Green dyes, exhibit weak fluorescence until bound to DNA and the fluorescence intensity is proportional to the amount of dye bound to the amplified product. Employing double-stranded dyes (also known as primer-only assays) is cost-effective, as only two sequence-specific primers are needed. This makes dye-based assays ideal for analyzing large numbers of samples and multiple targets. However, a drawback of intercalating dyes is that they bind to any double-stranded DNA and can therefore produce signals from non-specific products, giving rise to inaccurate results. Non-specific background may result from primers that bind each other (primer-dimer formation), or from non-specific amplification of regions unrelated to the target DNA. Melting curve analysis (measuring the dissociation characteristics of dsDNA during heating) is essential for monitoring the specificity of qPCR assays when using intercalating dyes.
Another issue with intercalating dyes is that only one target can be analyzed at a time —the fluorescent signals coming from different products in the reaction cannot be distinguished. Therefore, each reaction must be set up in a separate tube containing a primer mix which is specific for the target.
Probe-based qPCR employs target-specific oligonucleotide probes containing fluorescent reporters and quenchers combined with forward and reverse PCR primers. The quencher prevents the unbound probe from emitting any fluorescence. Incorporation of the probe into the amplicon during the PCR reaction results in removal of the quencher via the 5’-exonuclease activity of the DNA polymerase.
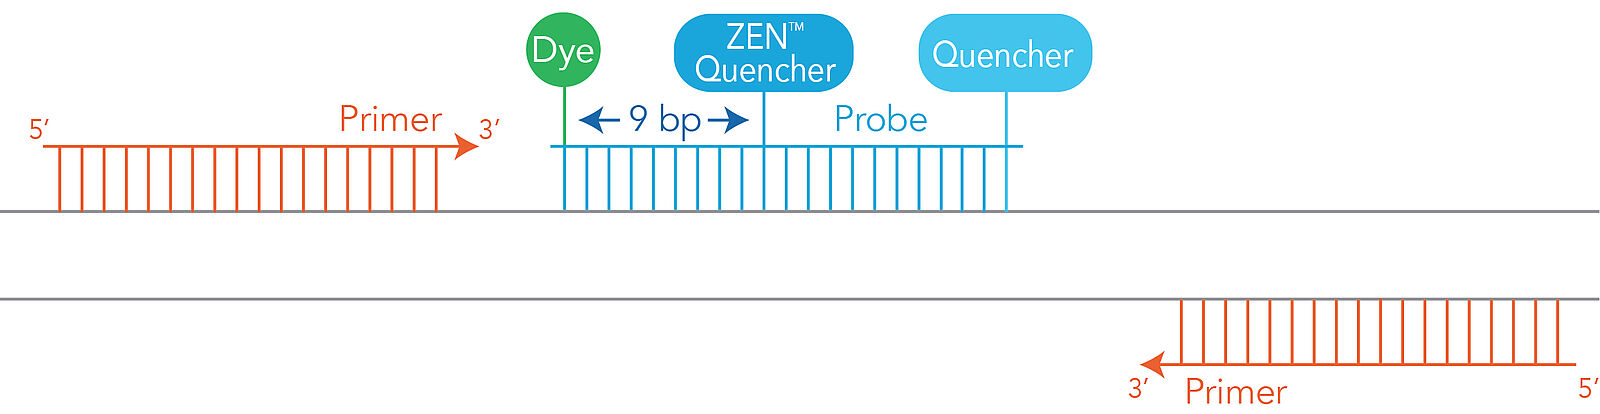

Typically, a probe contains a 5' fluorophore and a matching 3' quencher and is combined with forward and reverse PCR primers. In a first step, primers and probe hybridize to the target DNA sequence. At this stage, fluorescence is prevented by the close proximity of fluorophore and quencher in the probe. Next, DNA amplification begins when the DNA polymerase extends from the primers. Once the polymerase reaches the probe, it uses its 5’-exonuclease activity to degrade the probe, thereby removing the quencher. Once the quencher is removed, a fluorescence signal is emitted, which is detected and recorded by the qPCR instrument. These steps are repeated for each PCR cycle, resulting in the detection of the amplicons produced at each amplification cycle via the fluorescence generated.
Ideally, the quencher's absorbance spectrum should closely match the reporters' emission spectrum and there are several probe chemistries available, along with matching dyes and quenchers. For multiplexing assays, the reporter dyes selected should have little spectral overlap. The reporters must be compatible with the optical filters of the qPCR instrument and associated software. qPCR experts, such as Integrated DNA Technologies (IDT), provide custom probe design tools and many distinct formulations – including GMP-grade primers and probes.
Double-quenched probes
Probes now exist with two quenchers instead of a single quencher, known as double-quenched probes. Including a second, internal quencher in qPCR probes decreases the distance between 5’ dye and quencher which, in concert with the 3’ quencher, provides greater overall dye quenching, resulting in decreased background fluorescence and improved signal to noise ratio. IDT offers internal ZEN or TAO quenchers for use in double quenched probes.

qPCR applications: gene expression profiling
The most classical qPCR application is gene expression profiling, which analyzes and quantifies messenger RNA (mRNA) in a sample. Key applications include the analysis of transcriptome profiles in humans, animals or cells, or investigating the effects of external and internal stimuli on the transcriptome.
The main steps in gene expression profiling are sample preparation, conversion of mRNA to cDNA and finally, quantification of cDNA levels by qPCR. Sample preparation usually involves collection of tissues or cells, followed by lysis to release nucleic acids. mRNA is then isolated using an appropriate method – either conventional phase separation or using a specific kit for mRNA purification. It is crucial to obtain highly pure, undegraded mRNA, which is free of any contaminating DNA. Specialized suppliers like Norgen Biotek offer a range of kits for simple and fast purification of mRNA from a variety of tissues and cells.
Once collected, mRNA is converted to cDNA using a reverse transcriptase (RT) enzyme together with either non-specific primers to convert the entire mRNA pool (oligo(dT) or random hexamer primers) or gene-specific primers. After reverse transcription, the mRNA is removed by RNase to obtain pure, double-stranded cDNA, which is used as input for the qPCR assay.
The quality of the final cDNA depends strongly on the RT enzyme used. It is recommended to use a thermostable, efficient reverse transcriptase with reduced RNase H activity, such as the FastGene Scriptase II.
Controls are crucial in gene expression workflows. Relative quantification compares the expression of the gene of interest with a housekeeping gene (endogenous control). More than one reference gene can be employed, and the stable expression of the control must be validated under the conditions of the qPCR assay. Once the gene of interest is normalized to the housekeeping gene in the sample, the normalized numbers are compared between samples to obtain a fold change, which provides information on gene expression dynamics. Absolute quantification may also be used to measure gene expression levels in absolute copy numbers. For this, known amounts of a target gene template are used to create a standard curve, which is then used to quantify the number of copies of the target gene in the sample.
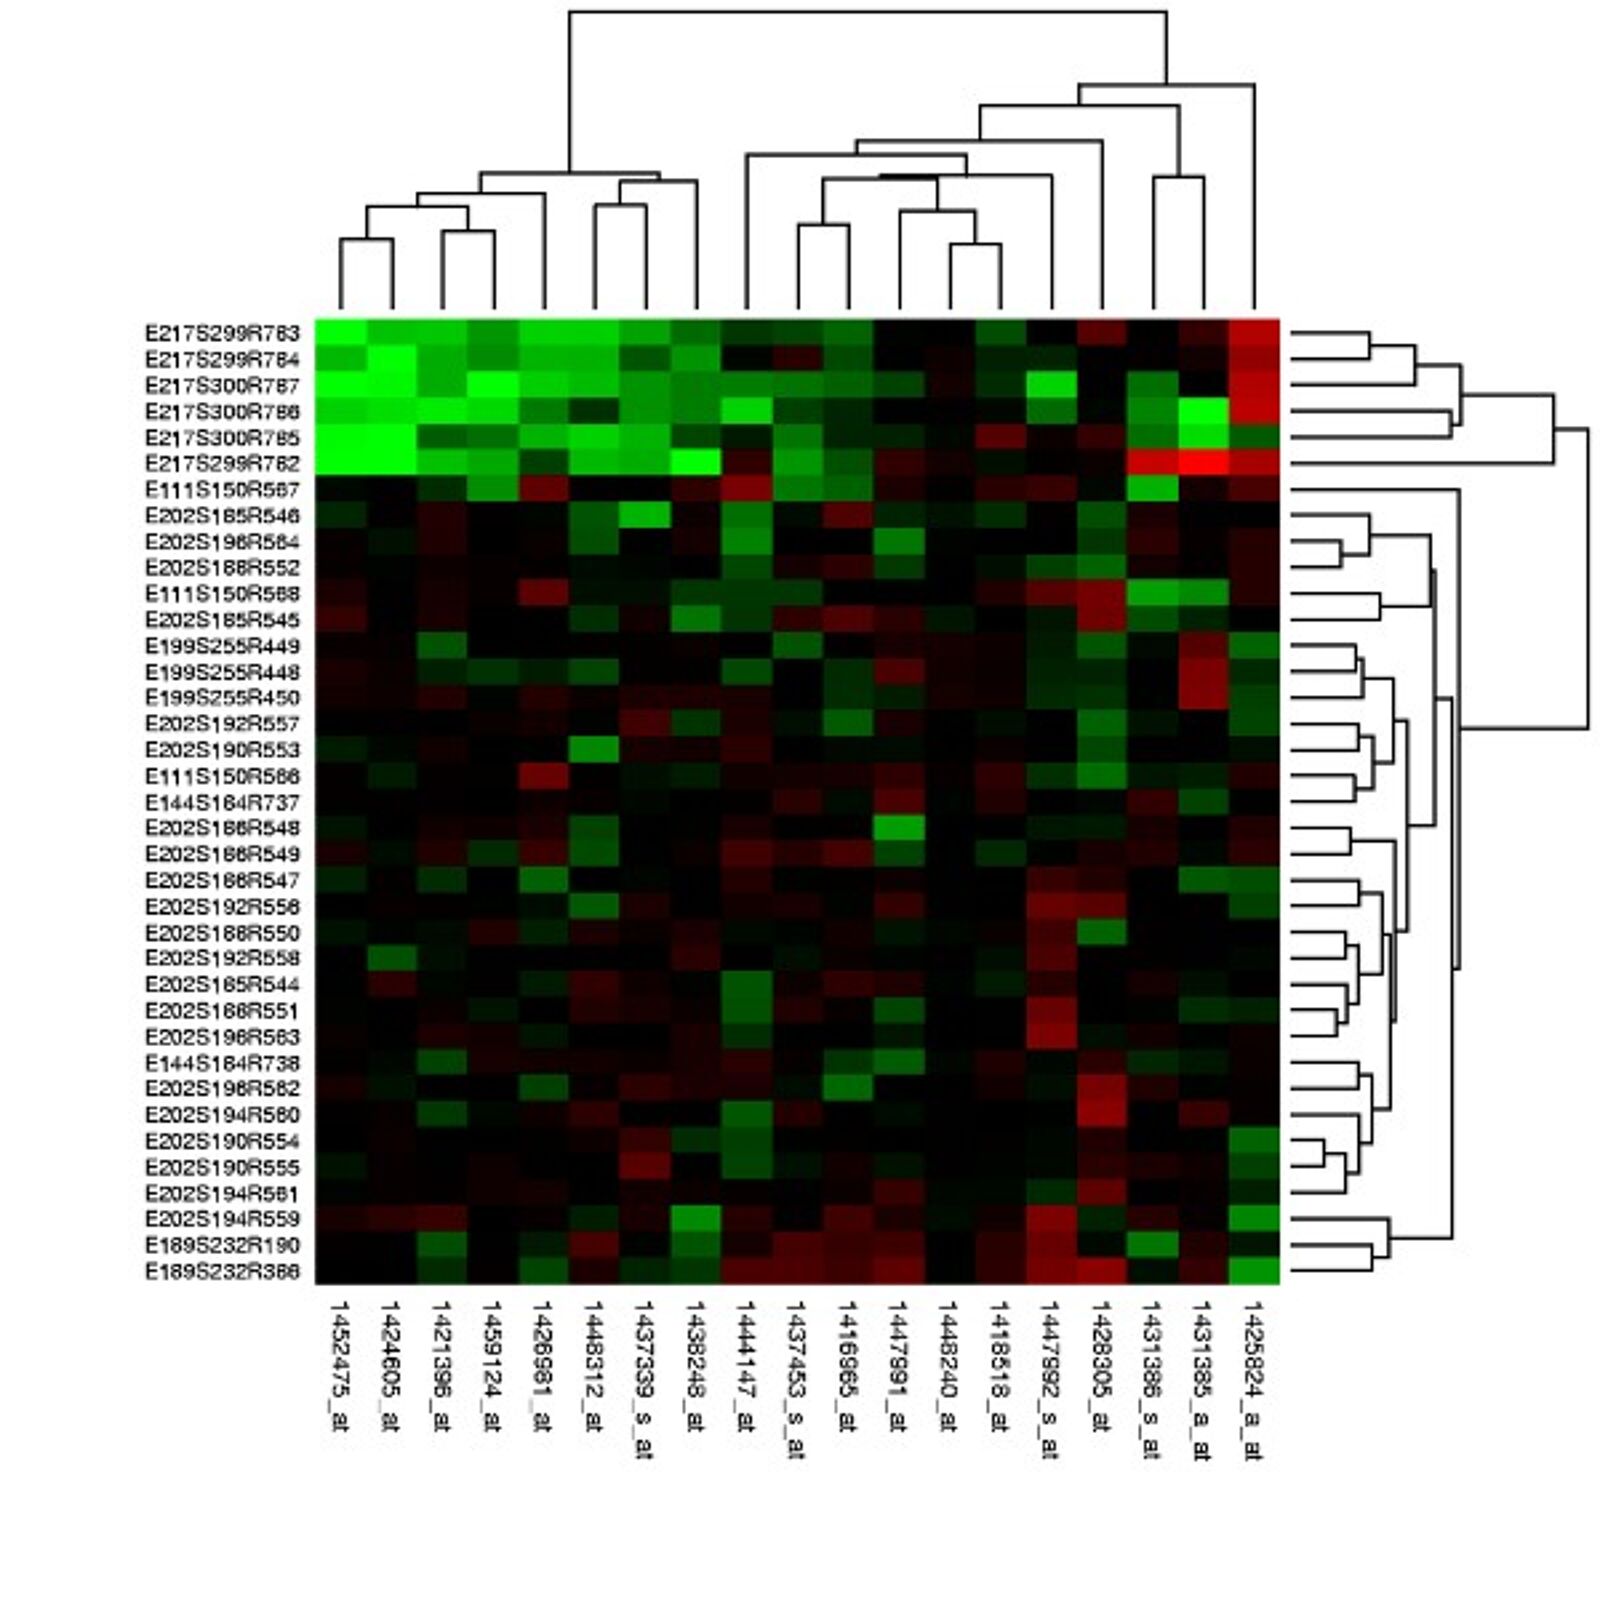
Differences in gene expression of a terget cell or tissue (for example when stimulated with a cytokine or a small molecule) are often expressed as heat maps. The gene expression heat map on the right shows up- and down-regulated genes after stimulation. Green indicates reduced expression. Cluster analysis has placed a group of down regulated genes in the upper left corner.
One-step vs two-step assays for qPCR
RT-PCR protocols either combine the reverse transcription and qPCR step (one-step) or run both reactions separately (two-step). One-step approaches work well when using gene-specific primers for the RT step and offer the advantage of speed and convenience.
Two-step protocols separate the reverse transcription and qPCR steps. This means a greater repertoire of buffers, reaction conditions, and priming strategies (oligo (dT), random primers, or sequence-specific primers) can be utilized.
Each assay type has advantages and disadvantages; the choice depends on the overall workflow, the enzymes and buffers used, and the target gene(s) of interest. One-step protocols can save time and are ideal for streamlined, rapid protocols. Prime-Time One-Step RT-qPCR master mixes contain everything needed for probe-based qPCR in one tube, including a reverse transcriptase and a hot-start DNA polymerase. One-step master mixes are ideal for viral/pathogen detection in centralized and point-of-care testing facilities. The RapiDxFire Lyo-Flex 1-Step RT-qPCR 5X Master Mix is manufactured to ISO 13485 standards and also contains a heat-activated thermostable RT enzyme designed to tolerate higher temperatures.
The drawback of one-step protocols is that optimization is challenging; also, sensitivity may be compromised by the combination of RT and qPCR reactions. Two-step assays are more flexible, allowing for different primer strategies and optimization of buffer conditions and reaction parameters. Again, the availability of different master mixes helps with optimization. The PrimeTime Gene Expression Master Mix for two-step gene expression RT-qPCR protocols contains antibody-mediated hot-start DNA polymerases, dNTPs and buffer components and provides highly efficient qPCR conditions for fast or standard cycling.
qPCR applications: genotyping
Another important application for qPCR is genotyping — the determination of genetic variations among individuals in a population. The most common types of genetic variations are single nucleotide polymorphism (SNPs), a single-base difference at a specific locus. SNP analysis using qPCR therefore allows the accurate and sensitive estimation of very low SNP allele frequencies in a DNA pool.
Similar to gene expression studies, the quality of the input material – in this case genomic DNA – is crucial. Improper isolation of genomic DNA may result in contaminants which inhibit the qPCR reaction and in partially degraded DNA. The QuickExtract DNA extraction solution enables rapid and straightforward extraction of pure, undegraded genomic DNA without having to resort to centrifugation, spin-columns, or toxic chemicals.
Four different oligonucleotides are used in a SNP genotyping assay. A primer pair flanks the SNP region within the target gene. To this, two allele-specific probes that contain the single base mismatch and which are marked with separate fluorescent dyes and a quencher, are added. One probe is designed to bind to the wild-type allele, and the other one to the mutant allele of the SNP of interest. After amplification, fluorescent signals are visualized using an allelic discrimination plot. There are three clusters when plotting the signals obtained from several samples in a single allelic discrimination plot – homozygote wild-type, heterozygous, and homozygous mutant.

In summary, qPCR is a central molecular biology technique with great significance in research, diagnostics, and various other fields. Its ability to accurately measure the amount of DNA or RNA present in a sample makes it a powerful tool for gene expression analysis, pathogen detection, and quantification of specific genetic sequences. By providing rapid, sensitive, and precise results, qPCR enables scientists and healthcare professionals to gain valuable insights into disease mechanisms, identify potential therapeutic targets, and monitor treatment responses. Its widespread application in fields like genetics, microbiology, oncology, and environmental science underscores its importance as a versatile and indispensable tool, advancing our understanding of biological processes and improving human health and well-being.
Want to learn more? Download IDT's qPCR handbook!
| Filename | Download |
|---|---|
| IDT-Handbook_Real-time_qPCR_Lubio_2024.pdf |