Following our blog about spatial proteomics, “Proteomics and the importance of spatial distribution”, here, we discuss the challenges in this field and how researchers are devising methods and technologies to overcome these scientific hurdles. This blog is the second part of a two-part series on spatial proteomics. Read part one here.
Sample sensitivity
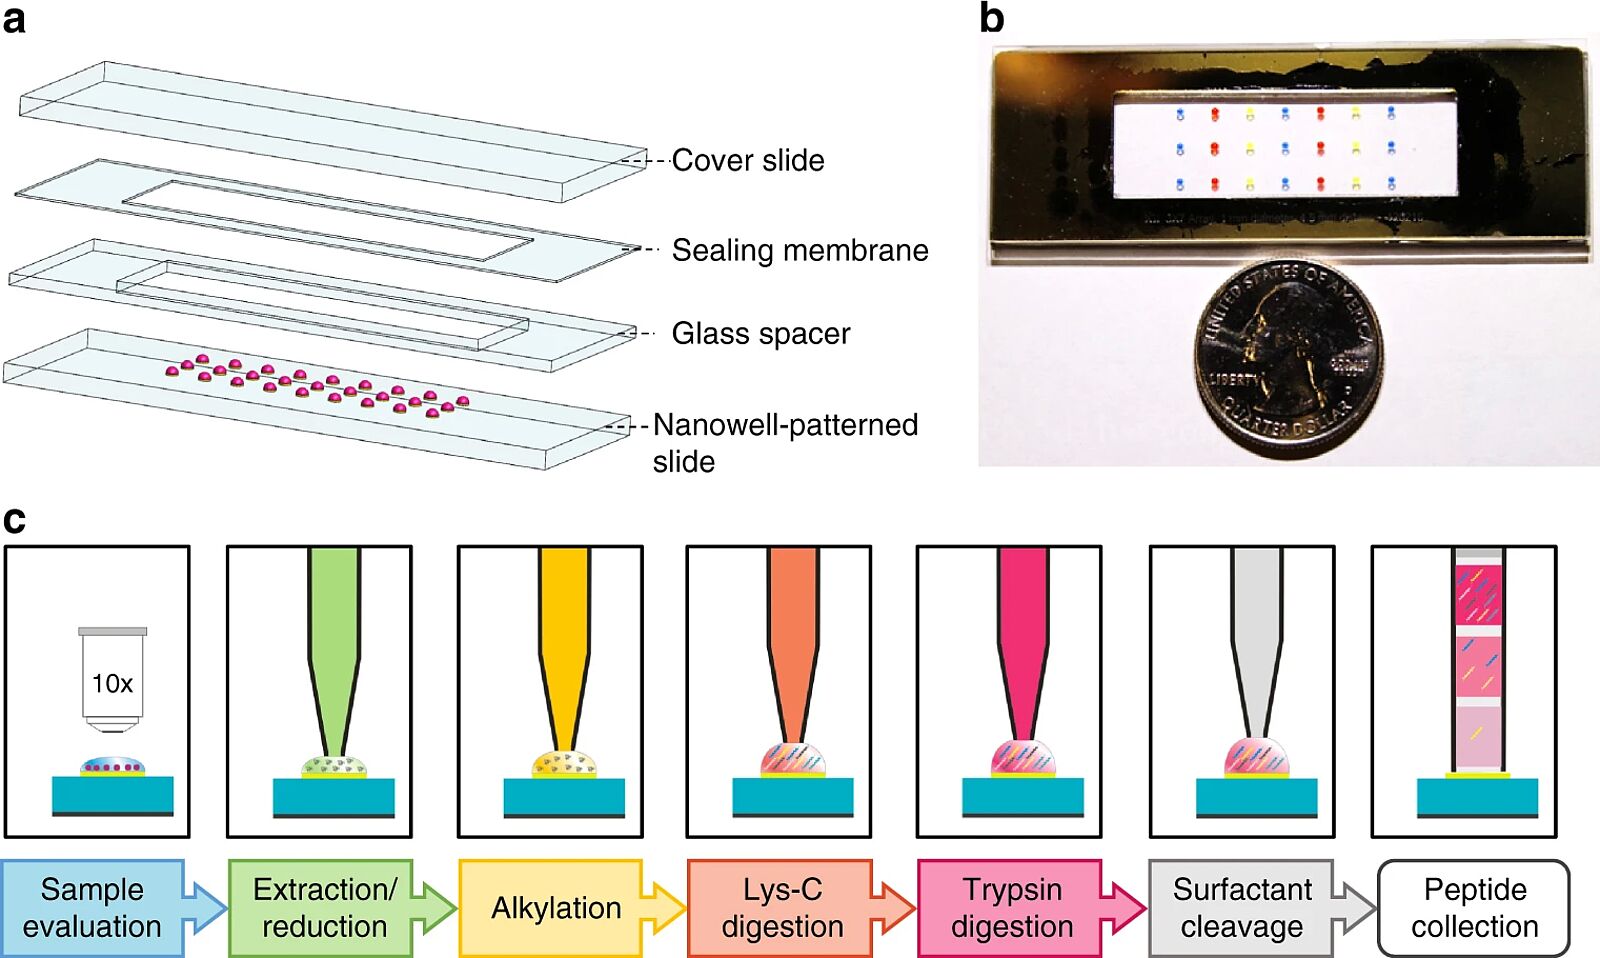
One of the challenges of spatial and single-cell proteomics is sensitivity. Sensitivity is limited by the inherent “sticky” nature of proteins that lead to nonspecific adsorption to reaction vessels. This, in turn, leads to sample losses from the numerous sample preparation steps. The steps include sample lysis, protein extraction, and digestion into peptides. Separation steps follow before mass spectrometric and data analysis. To reduce sample loss in these steps, an approach named nanoPOTS has been developed. NanoPOTS, standing for Nanodroplet Processing in One Pot for Trace Samples, allows the sensitive proteomic analysis of small cell populations. As the name suggests, the NanoPOTS approach performs all reactions from cell lysis to chemical digestion and separation in a single nanodroplet (<200 nL). The spots are robotically dispensed onto a patterned glass slide.
By performing all reactions in a droplet rather than a tube, the surface area of the sample is drastically reduced (by ~99.5%), leading to improved sample recovery. Digestion kinetics by digestion enzymes, which is concentration-dependent, is also higher in the nanoPOTS approach. Inadequate enzyme digestion may inhibit the production of peptides and so affect identification by MS. By combining the nanoPOTS approach preparation with liquid chromatography-mass spectrometry (LC-MS), the researchers, Zhu et al., could identify ~1500 to ~3000 proteins from ~10 to ~140 cells, respectively(1). To put this figure into context, in 2016, a method was reported to identify 1270 proteins from 2000 HEK 293 culture cells(2). More recently, the nanoPOTs approach has been teamed with laser microdissection and capillary electrophoresis to analyze specific areas from rat brain cortex and hypothalamus regions. The microfluidic-based workflow has identified distinct spatial distributions of post-translational modifications in the two tissue regions(3). A limitation of this approach is the use of specialized equipment.
Complex datasets
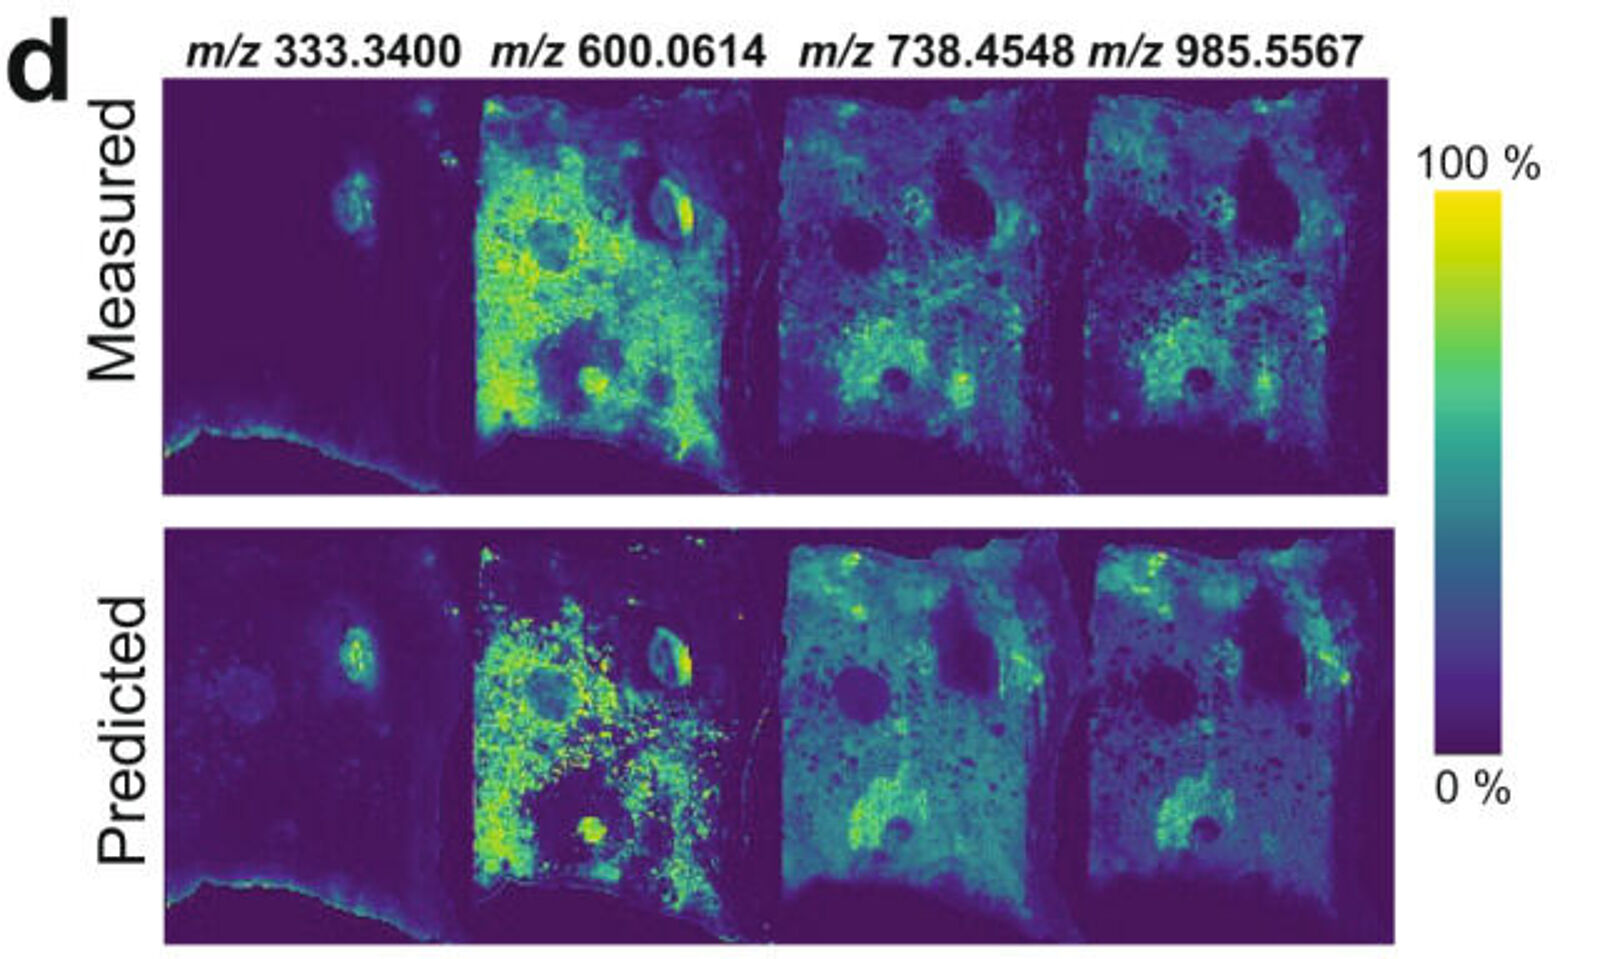
Matrix-assisted laser desorption/ionization (MALDI) mass spectrometry imaging (MSI) is commonly used in spatial proteomics. MALDI-MSI has the advantage of visualizing the spatial distribution of molecules on a sample surface without requiring any labels. Data from the analyte of interest is extracted from a precise spot on the sample, and a spectrum is generated containing a distinct mass/charge peak. An image can be reconstructed from the intensity of each spot to describe the spatial distribution of molecules across the surface of a sample (2D MALDI-MSI data). Obtaining 2D MALDI-MSI data from serial sections and merging the data enables a 3D MALDI-MSI to be built. The challenge with working with these datasets is the sheer volume of data. A 2D MALDI-MSI dataset exceeds 1 gigabyte, typically comprising 5000–50,000 spectra, and a 3D MALDI-MSI dataset is up to hundreds of gigabytes per dataset(4). The large data size poses computational and memory problems, which may impede the discovery of clinically relevant molecular signatures in tissues.
Researchers from Harvard Medical School recently described a generative model — a type of unsupervised machine learning tool — to look for clinically-relevant molecular patterns from MSI data deriving from different mass spectrometers and data sources(5). The generative model named the msiPL method was connected to an unsupervised neural network – a type of machine learning that teaches computers to process data in the same way as neurones process information in the human brain. The model was used to simplify a pre-processing step used in MSI data [both MALDI and derivatives of electrospray ionization (ESI)] — peak picking — where peaks are identified to increase the signal-to-noise ratio while reducing the complexity of the original spectrum. Although algorithms are in place for this pre-processing step, a certain level of subjectivity is considered to be involved in their deployment, leading to bias. In the study, the msiPL method was unsupervised and allowed the discovery of molecular patterns from highly complex 2D and 3D MSI data sets of biological samples. The authors concluded that the workflow reduced the time taken to analyze large and complex new data(5).
Multimodal MSI data integration
MSI is commonly used together with other types of staining and imaging. For example, it is common for a hematoxylin and eosin (H&E) stain to be used following MSI. In this case, the datasets need to be married up to elucidate molecular signatures, a process known as registration. The co-registration step is no easy feat and is integral in multimodal MSI workflows. Patterns can then be elucidated from the data alongside joint statistical analysis. As with all data, an error can occur in the precision of registration. In the past, these errors have been negligible, but as the spatial resolution of the datasets increases, the significance of the error also increases. Therefore, image registration still poses a challenge for workflows with multiple MSI methods.
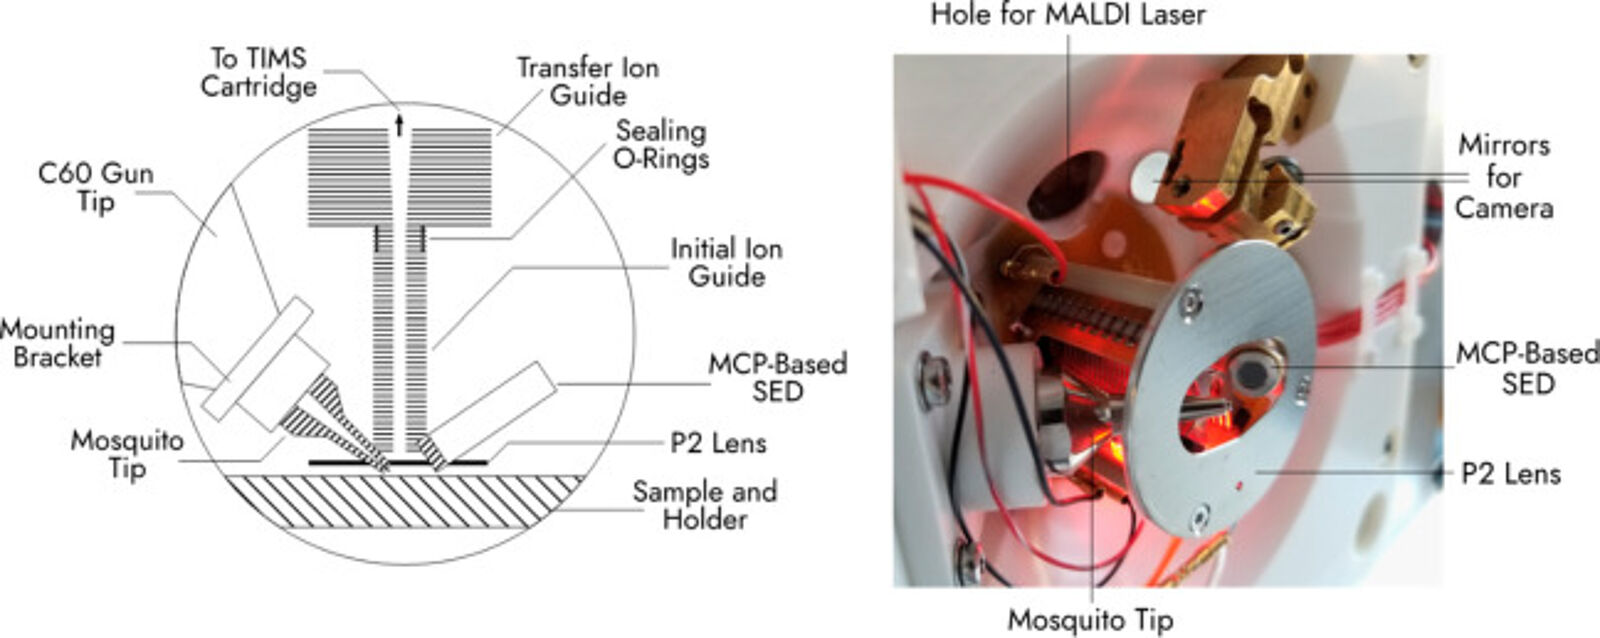
A study published this year in the Journal of the American Society of Mass Spectrometry describes an approach that combines two types of MSI —that conventionally need two separate MS instruments — into one instrument with multiple imaging modes(6). Secondary ion mass spectrometry (SIMS) and MALDI are two ionization approaches. MALDI needs a matrix to be applied to the sample for ions to be generated. SIMS uses the ion beam as a surface probe, which generates secondary ions for detection. MALDI suffers from low lateral resolution but has a broader mass range (~500 Da to >100 kDa), whereas SIMS detects with a higher resolution at a lower mass range (<1000 Da)(7). By combining the two methods in one instrument, the study authors produced a workflow with facile data integration and imaging alignment as the laser and ion gun are on the shared stage. In addition, sample transfer was eliminated, which reduced sample degradation. The authors explained that the workflow could be applied to existing commercial mass spectrometers and needs only a few custom modifications.
Similar articles Correlative mass spectrometry imaging, applying time-of-flight secondary ion mass spectrometry and atmospheric pressure matr
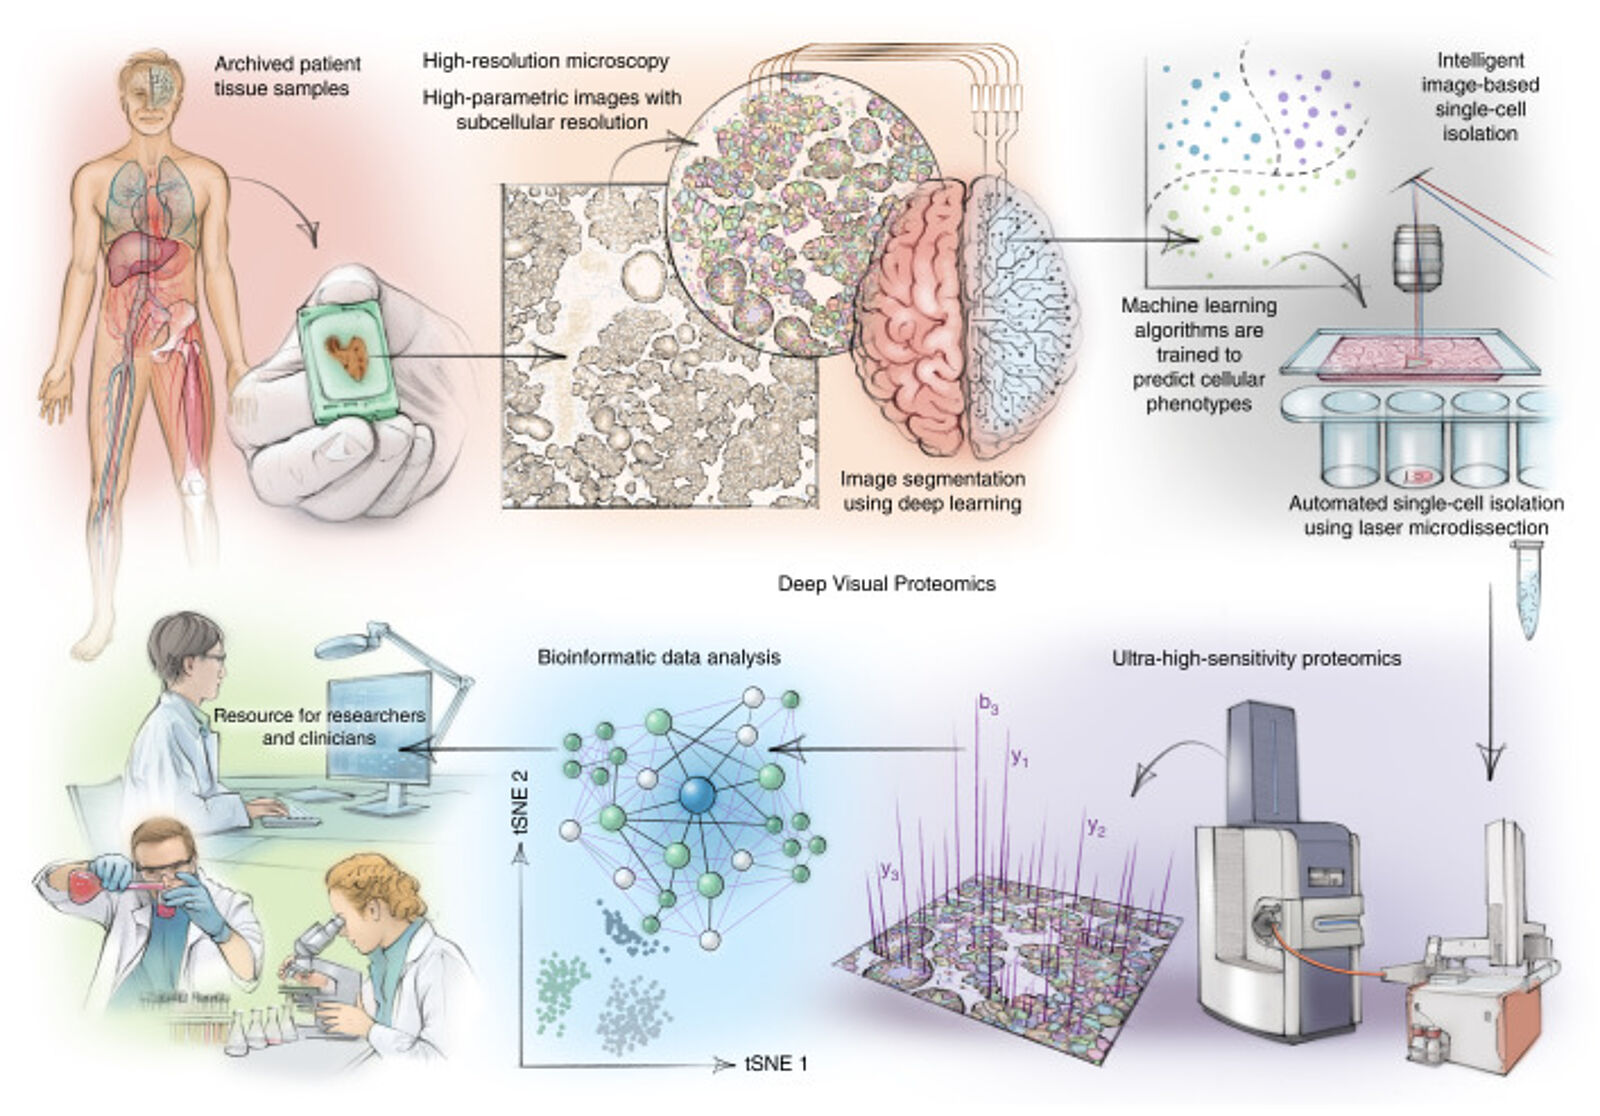
Localizing and quantifying proteins within specific subcellular structures remains at the heart of spatial proteomics. Key challenges lie in accurately identifying single-cell boundaries, for instance, between normal and diseased tissue. Selection is usually performed manually using observed phenotypes in images. However, errors can lead to admixing of different cell types. A publication by Mund et al. in Nature Biotechnology describes a strategy employing artificial intelligence — machine learning to automate the selection and classification of cells using Laser Microdissection (LMD). The approach, named Deep Visual Proteomics (DVP), first selected cellular and subcellular objects either unsupervised or with instruction and then generated proteomic profiles using MSI from these objects(8). Data were generated using LC-MS employing trapped ion mobility spectrometry (TIMS) on an orthogonal quadrupole time-of-flight (QTOF) mass spectrometer using a nanoelectrospray ion source. The first proof of principle experiments could analyze distinct cell states from cell culture to produce proteomic profiles. The DVP approach could also shed light on proteomic changes deriving from the transition of normal melanocytes (melanin-producing skin cells) into fully invasive melanocytes, which cause one of the most serious types of skin cancer — melanoma.
Researchers are actively finding solutions to challenges in spatial proteomics. An important consideration is the applicability of an approach and technology to the broader scientific community.
References
- Zhu, Y. et al. Nanodroplet processing platform for deep and quantitative proteome profiling of 10-100 mammalian cells. Nat Commun9, (2018).
- Chen, W. et al. Simple and Integrated Spintip-Based Technology Applied for Deep Proteome Profiling. Anal Chem88, (2016).
- Liao, Y. C. et al. Spatially Resolved Top-Down Proteomics of Tissue Sections Based on a Microfluidic Nanodroplet Sample Preparation Platform. Mol Cell Proteomics22, (2023).
- Thiele, H. et al. 2D and 3D MALDI-imaging: Conceptual strategies for visualization and data mining. Biochimica et Biophysica Acta - Proteins and Proteomics vol. 1844 Preprint at doi.org/10.1016/j.bbapap.2013.01.040 (2014).
- Abdelmoula, W. M. et al. Peak learning of mass spectrometry imaging data using artificial neural networks. Nat Commun12, (2021).
- Krijnen, K. et al. A Multimodal SIMS/MALDI Mass Spectrometry Imaging Source with Secondary Electron Imaging Capabilities for Use with timsTOF Instruments. J Am Soc Mass Spectrom (2022) doi:10.1021/jasms.2c00381.
- Monroe, E. B. et al. SIMS and MALDI MS imaging of the spinal cord. Proteomics8, (2008).
- Mund, A. et al. Deep Visual Proteomics defines single-cell identity and heterogeneity. Nat Biotechnol40, (2022).
Suppliers
Absolute Antibody
Absolute Antibody is an expert in engineering recombinant antibodies for in vivo research. Their custom services include hybridoma sequencing, antibody engineering and expression.
Bethyl Laboratories - Fortis Life Sciences applies B-cell sorting and recombinant DNA technology to deliver high quality recombinant rabbit monoclonal antibodies. The pillar strategy validation ensures that the antibody works in the stated applications.